
Monitors have found all thirteen species known to occur in our region. Below is a summary of who has been found from the most common species to the least.
Based on abundance, the frogs and toads fell roughly into 3 groups:
Group 1
Chorus Frog, Green Frog, American Toad and Bullfrog were commonly discovered at most locations.
Group 2
Spring Peeper, Cope’s and Eastern Gray Treefrog and Northern Leopard Frog were less common but locally abundant during certain years.
Group 3
Cricket Frog, Wood Frog, Fowlers Toad, Plains Leopard Frog and the Pickerel Frog were generally quite rare and local.
Numbers and species of frogs/toads recorded are highly dependent on temperature, weather and terrain, so their relative abundance varied from place to place and from year to year.
The Calling Frog Survey: A trend analysis of the proportion of sites occupied by our regional frog species from 2004-2021
Prepared by Allison Sacerdote-Velat, Ph.D.
Overview
Monitors have found all thirteen species known to occur in the Chicago Wilderness region. However, some species are far more widespread, while others have greater habitat specificity that limits their distribution. For example, Plains leopard frogs are found in some of the sand prairie habitats in the region. If you do not have this habitat type along your route, you would not expect to find the species there.
Using 18 years of community science data from our frog monitors, we have examined trends in the proportion of sites occupied by each species between 2004 and 2021. For this analysis, we included 79 survey routes that had at least four seasons worth of data. If you have only recently joined the network, we hope you will continue monitoring so we can incorporate your site into additional long-term analyses. We used four years of data as a minimum because annual conditions such as droughts, late springs, and flooding can influence which species will use a site for breeding in a given individual season. Four years also allows for some variation in environmental conditions and is reflective of the reproductive generation time for the larger-bodied frogs, while some of the smaller frogs may reach reproductive maturity within a single year.
For each species, we use the frog monitors’ data to create an encounter history for each site. Each species has a different likelihood of being detected by monitors based on the survey window, air temperature, and wind speed. So while some species are very audible, like boreal chorus frogs and spring peepers, other species are more likely to be missed, like northern leopard frogs and wood frogs which call underwater. Because each species of frog has “imperfect detection”, we create models of the proportion of sites occupied, which accounts for the likelihood of a particular species being heard or detected during each survey window.
Species Trends
Common Species
The most widespread species in the entire survey area, spanning 10 counties in the Chicago Wilderness region, was the boreal chorus frog. Site occupancy for the boreal chorus frog did not show any significant change over the 2004-2021 time window (Fig. 1). The proportion of occupied sites was consistently greater than 80% (or 0.8 in the figure below). The slight decrease visible in the 2019-2021 year block reflects that a smaller number of sites were able to be sampled in 2020 during the first monitoring round, because of COVID-19 lock down. Additionally, the severe drought in 2021 dried many breeding ponds very early in the season.
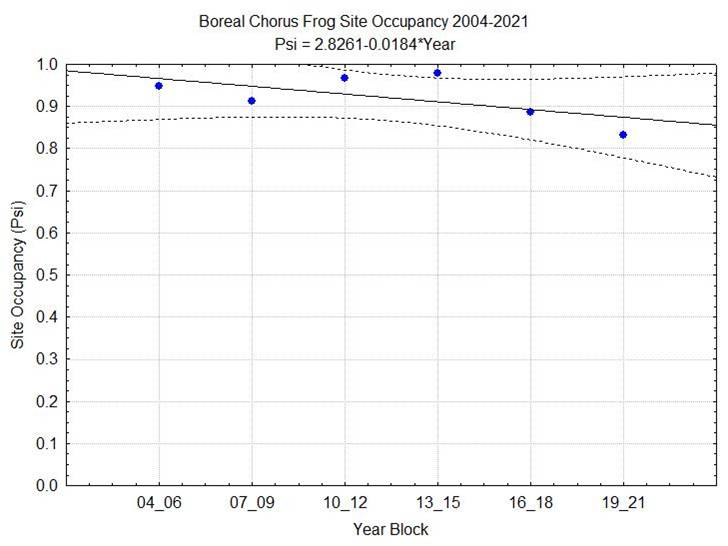
Figure 1. Proportion of sites occupied by boreal chorus frogs between 2004 and 2021 based on encounter histories from 79 survey routes. Dashed lines represent the 95% confidence interval.
We found that American bullfrog and green frog site occupancy has been significantly increasing in the region over the last 18 years. American bullfrogs were generally found on 40-60% of surveyed sites (Fig. 2).
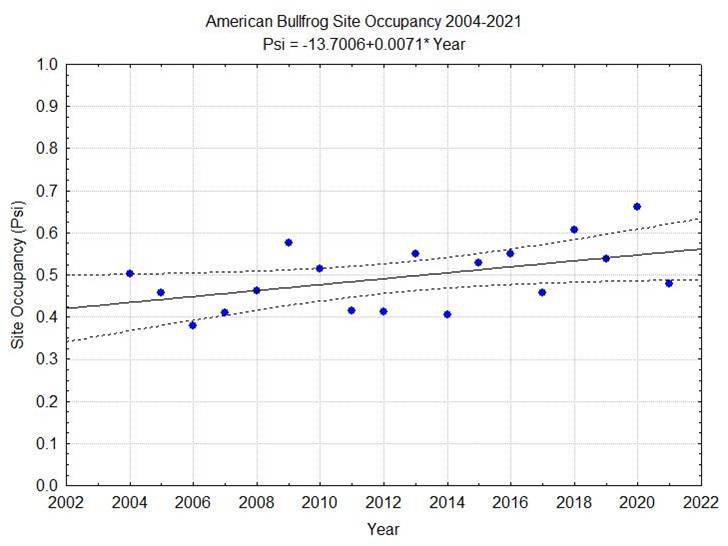
Figure 2. Site occupancy of American bullfrogs between 2004-2021 based on encounter histories from 79 survey routes. Dashed lines represent the 95% confidence interval.
Green frogs have also shown a significantly increasing trend in site occupancy, although they have been found on a smaller proportion of sites than American bullfrogs (Fig. 3). Green frog site occupancy has remained between 30-50% of sites in the last 18 years.
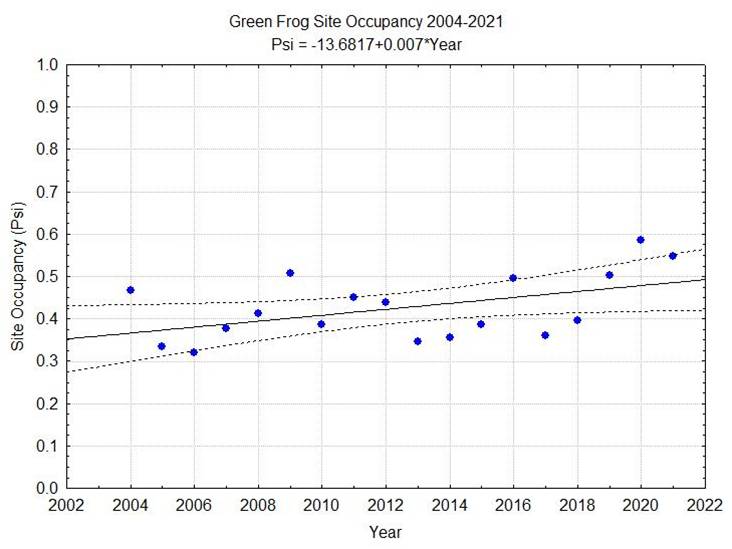
Figure 3. Site occupancy of green frogs between 2004-2021 based on encounter histories from 79 survey routes. Dashed lines represent the 95% confidence interval.
Both American bullfrogs and green frogs breed in permanent bodies of water, typically with dense vegetation such as duckweed. The tadpoles of both species may overwinter for multiple seasons, and may co-occur in sites with fish. Because of their use of permanent water bodies and because of their large body size, bullfrogs and green frogs can make use of many artificial or highly modified water bodies such as detention basins, golf course ponds, and lagoons in city parks. Their larger body size enables greater dispersal between sites, so they are more likely to colonize new breeding sites than many of the smaller frog species in the region.
American toads, the most terrestrial of our regional frogs, occurs in about 55-65% of the routes in the region. While we are observing a slight downward trend in American toad site occupancy, it is not a significant decline in occupancy across years (Fig. 4). We observed noticeably lower site occupancy for American toads in 2012 and 2021 (circled in red in the figure), the two most severe droughts in the region in the 18 years included in the analysis. Because American toads breed beginning at the end of Round 1 into Round 2, their phenology coincides with the point in each of the drought years when most of the breeding ponds were drying up.
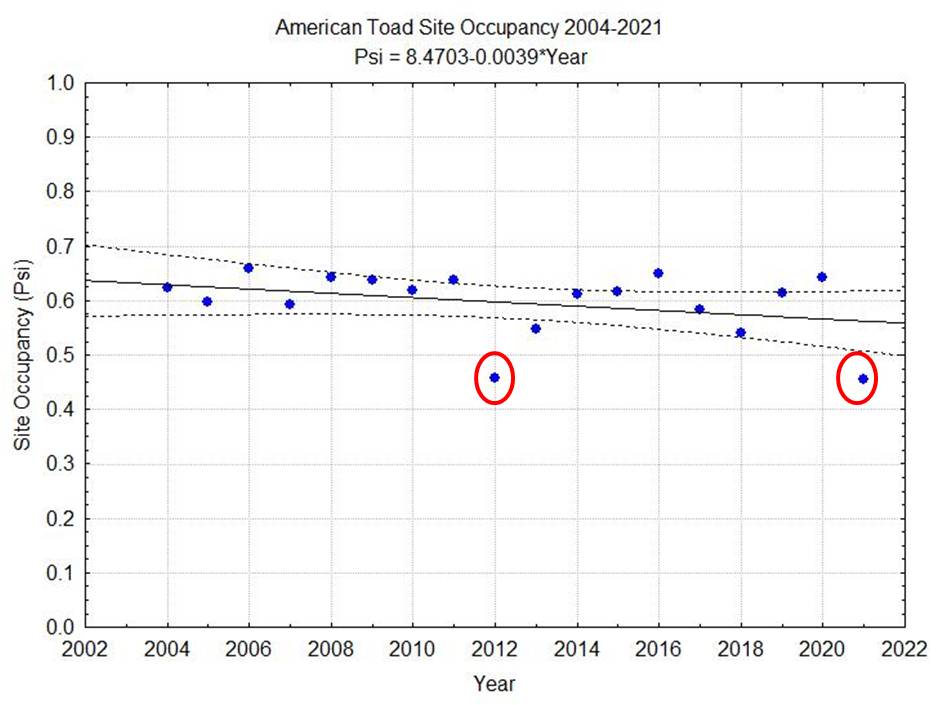
Figure 4. Site occupancy of American toads between 2004-2021 based on encounter histories from 79 survey routes. The red circles indicate severe drought years when ponds dried during the typical window for peak calling activity for American toads. Dashed lines represent the 95% confidence interval.
Northern leopard frogs did not exhibit a significant trend in site occupancy between 2004 and 2021. They were found on 45-55% of the survey routes in the region (Fig.5). Detection rates for northern leopard frogs are generally lower than some of the other large pond frogs because they inflate their vocal sacs underwater when calling, so the call is naturally muffled to our ears. Additionally, because their calling activity occurs during Round 1 (typically late March/early April) their calls are often masked by the louder calls of the boreal chorus frog and spring peeper. If you want to ensure that you can detect the northern leopard frog call, we recommend recording the calls you hear on your route and then playing them back at home. Many digital media players on computers allow you to adjust the treble and bass settings so you can reduce the high frequency calls and boost audibility of the low frequency calls. Similarly, we are happy to run any recordings through spectrogram software to visually pick out the masked calls.
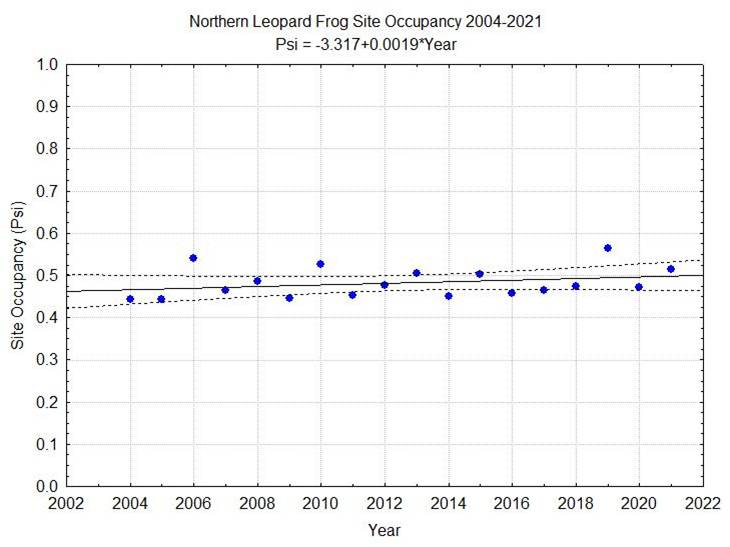
Figure 5. Site occupancy of northern leopard frogs between 2004-2021 based on encounter histories from 79 survey routes. Dashed lines represent the 95% confidence interval.
Spring peepers, one of the most readily detectable species in the survey area, did not exhibit a significant trend in site occupancy over the last 18 years (Fig. 6). While we are aware of localized declines from a few sites, we also had a few colonization events where monitors detected spring peepers in recent years after several seasons with no evidence of their activity in particular sites. Overall, spring peepers occupied between 39-57% of our survey routes between 2004 and 2021.
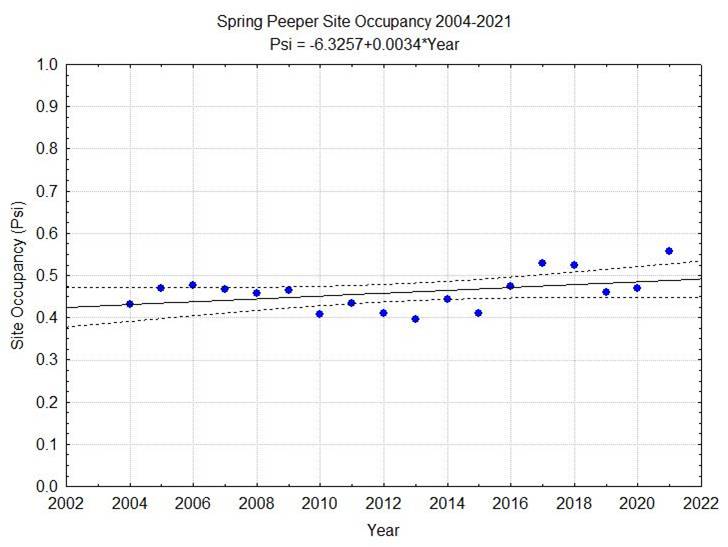
Figure 6. Site occupancy of spring peepers between 2004-2021 based on encounter histories from 79 survey routes. Dashed lines represent the 95% confidence interval.
For the purposes of these long-term analyses, we combined the two species of gray-treefrogs into one gray-treefrog complex as we lack verification of which gray treefrog was detected for some of the early years of the program. We did not observe a significant long-term trend in gray treefrog site occupancy. The site occupancy for gray treefrogs ranged from 38-50% of survey routes (Fig. 7).
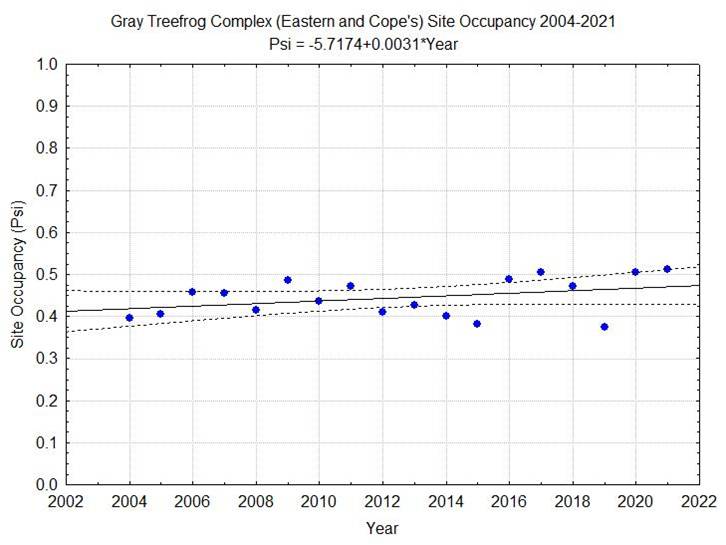
Figure 7. Site occupancy of gray treefrogs (combined eastern and Cope’s) between 2004-2021 based on encounter histories from 79 survey routes. Dashed lines represent the 95% confidence interval.
Wood frogs, one of the early, explosive breeders, are highly isolated in their geographic distribution in the Chicago Wilderness region with their stronghold in northwestern Indiana’s dune swale ponds and flatwoods. We did not find a significant trend in their site occupancy between 2004-2021, but we were also data deficient for a few of the known-occupied sites for several of the years included in the analysis. We collapsed observations into six 3-year blocks and examined site occupancy across the six time windows. In most years, wood frogs occupied less than 5% of the survey routes. Wood frogs are a challenging species for monitors to detect because of their explosive breeding behavior. They may call for a single night or for about a week and a half. While they may be found calling when ice is present on the ponds, in our survey data, monitors typically detect them after the boreal chorus frogs have started calling, rather than in advance of them. In most occupied sites, the chorus frogs and spring peepers are overlapping the wood frogs, so call masking is a possibility. However, the wood frogs are typically completing their calling during the last week of March or first week of April. Another challenge is distinguishing the territorial “chuck” sound of the northern leopard frog from the breeding call of the wood frog. Because of the similarity in the sounds, it is important to (1) record the calls and have them verified by the Calling Frog Survey director, (2) pay close attention to the phenology—if you are hearing a chuck in late mid to late April, it is much more likely to be a northern leopard frog than a wood frog. Both species inflate their vocal pouches underwater, so the sound is muffled for both calls, but they have distinct frequencies that we can examine using spectrograms to distinguish the identity of the species.
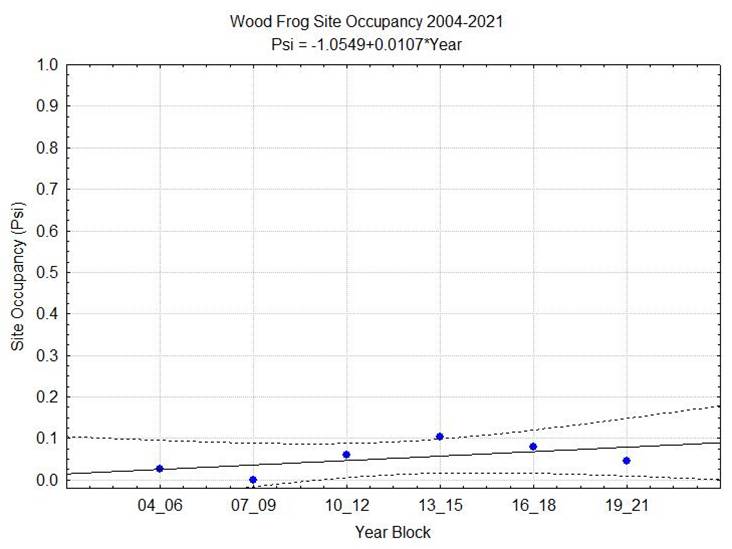
Figure 8. Site occupancy of wood frogs between 2004-2021 based on encounter histories from 79 survey routes. Dashed lines represent the 95% confidence interval.
The cricket frog is one of the rarest species in the region, occupying less than 5% of the survey routes. This was once a widespread species across northern Illinois counties, but recent studies have found enigmatic declines which may be associated with a number of drivers including habitat fragmentation and disease. In the sites where we do have cricket frogs, they are locally abundant and we are aware of a few colonization events in southern DuPage County and in DeKalb County. Many of the DeKalb county sites are newer additions to the monitoring program with less than four years of data, so they were not included in this long-term trend analysis. This analysis reflects cricket frog site occupancy with observations restricted to Will County and southern DuPage County.
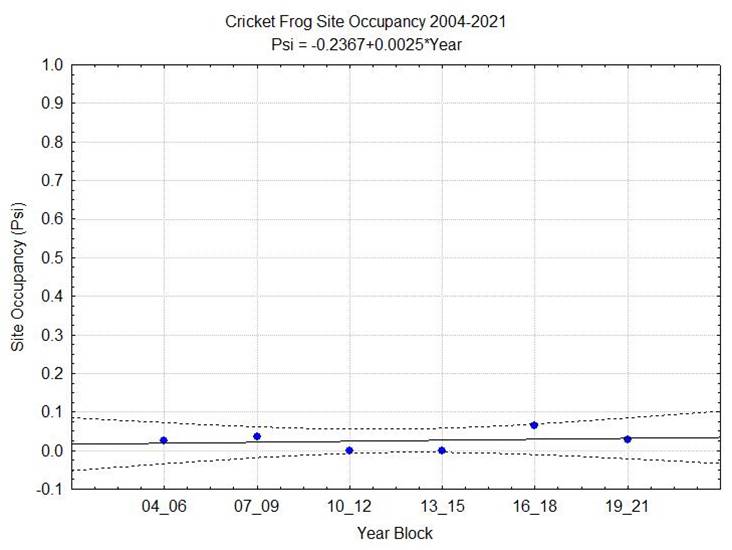
Figure 9. Site occupancy of cricket frogs between 2004-2021 based on encounter histories from 79 survey routes. Dashed lines represent the 95% confidence interval.
For the remaining rare species; the plains leopard frog, the Fowler’s toad, and the pickerel frog, we have only isolated observations from individual sites and we lack sufficient long-term data from these sites to conduct a trend analysis. If you think you are hearing the call of any of these three species, we need recordings in order to verify presence of these species. All three species have some habitat specificity to sand prairie for the plains leopard, dune/swale/interdunal ponds for the Fowler’s toad, and cold groundwater-fed springs and fens for the pickerel frog. Because of shoreline development, limitation of the extent of sand prairies, and regional hydrologic alteration, these species will be limited in distribution, but we would love to collect any data that we can from isolated sites where they may persist.
2022 Data
In 2022, we received data from frog monitors covering 104 survey routes in 10 counties in northern Illinois and northwestern Indiana. Ten of thirteen potential frog species were detected on survey routes within the region (Fig. 1). Across the routes, the most commonly detected species was the boreal chorus frog (Pseudacris maculata), detected on 81% of the routes. The next most commonly detected species were green frogs (Lithobates clamitans)on 60% of the routes, bullfrogs (Lithobates catesbeianus) on 57% of the routes, and American toads (Anaxyrus americanus) on 51% of the routes. Northern leopard frogs (Lithobates pipiens)were detected on 31% of the routes, and spring peepers (Pseudacris crucifer) were detected on 29% of the routes. For the two gray treefrog species, Cope’s gray treefrogs (Dryophytes chrysocelis) were detected on 28% of routes, while eastern gray treefrogs (Dryophytes versicolor)were detected on 17% of routes. Our least common species were cricket frogs (Acris crepitans blanchardi), detected on 6% of routes, and wood frogs (Lithobates sylvaticus), detected on 2% of routes. There were no verified detections (reports with an accompanying recording, video, or photo) of pickerel frogs (Lithobates palustris), Fowler’s toads (Anaxyrus fowleri), or plains leopard frogs (Lithobates blairi). Of the 104 routes for which we received data, 76% of the routes had complete data sets with at least one survey falling within each of the three monitoring windows. We received data for 24% of the routes for which we were missing 1-2 rounds of survey data often due to challenges with finding nights with appropriate weather conditions for monitoring or other circumstances preventing monitoring.
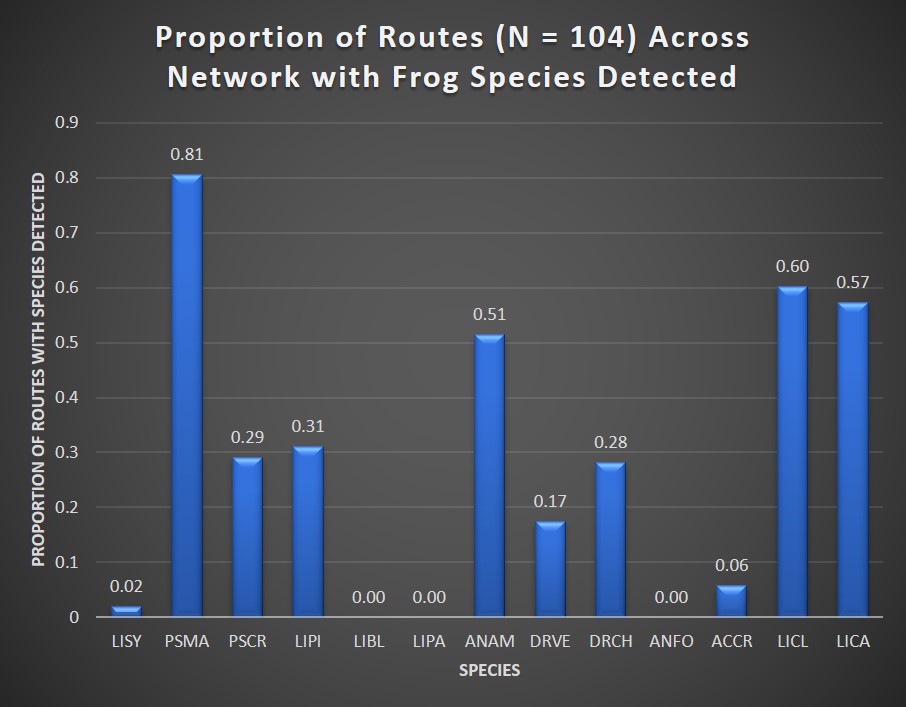
Figure 1. Proportion of survey routes (n = 104 total) with each frog species detected during 2022 surveys. Species abbreviations are as follows; wood frog (LISY), boreal chorus frog (PSMA), spring peeper (PSCR), northern leopard frog (LIPI), plains leopard frog (LIBL), pickerel frog (LIPA), American toad (ANAM), eastern gray treefrog (DRVE), Cope’s gray treefrog (DRCH), Fowler’s toad (ANFO), cricket frog (ACCR), green frog (LICL), and American Bullfrog (LICA).
Frog species richness ranged from 0 (no frog species detected) to a maximum of 8 species detected (Fig. 2). Cook County routes had a mean richness of 2.8 frog species, with a range of 0-6 frog species detected. DeKalb County had a mean richness of 4.3 species with a range of 1-6 species detected. DuPage County had a mean richness of 3.9 species with a range of 0-7 species detected. Kane County had a mean richness of 3.5 species with a range of 1-6 species detected. Lake County, IL had a mean richness of 4.7 species with a range of 3-7 species detected. Data were submitted for two Lee/Ogle County routes at Nachusa Grasslands with 6 and 7 species detected, respectively. McHenry County had a mean richness of 3.6 frog species with a range of 1-6 species detected. Porter County, IN routes had a mean richness of 5 species with a range of 3-8 species detected. Will County routes had a mean richness of 2.5 species with a range of 1-5 species detected. Winnebago County routes had a mean richness of 3.2 species with a range of 1-5 species detected.
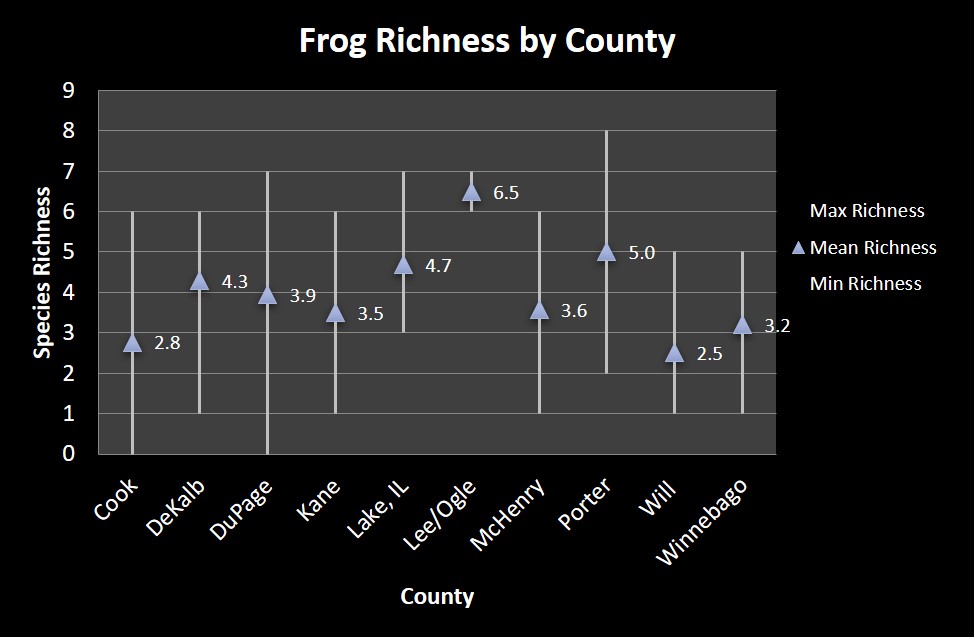
Figure 2. Mean, minimum, and maximum frog species richness for routes in each county where data were submitted during 2022.
Species-Specific Detection Across Survey Routes
Wood frog calls were only recorded and verified from two sites during 2022, one site in Lake County, Illinois, and one in Porter County, Indiana (Fig. 3). Several Indiana sites that had been monitored in past seasons did not have coverage by monitors in 2022.
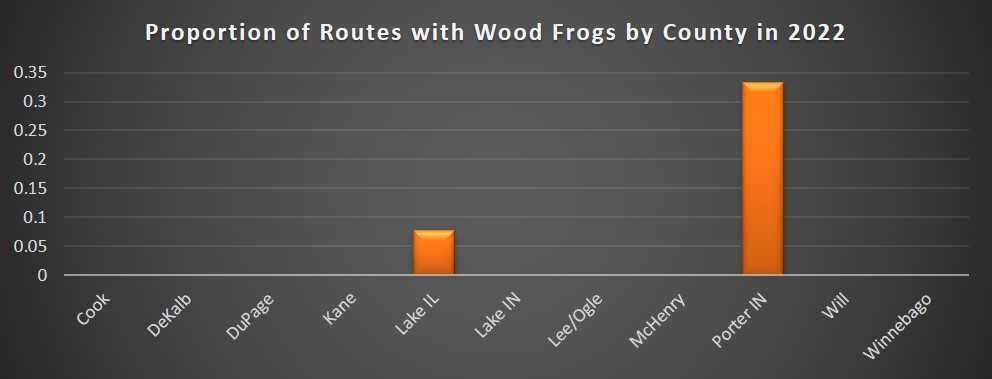
Figure 3. Proportion of 2022 survey sites with verified detections of wood frogs across participating counties.
Boreal chorus frogs were the most widespread species across survey routes in 2022. Between 60-100% of routes in each county reported the species (Fig. 4). Sites that lacked boreal chorus frogs tended to be highly urbanized parks within Chicago, and other locations with only permanent water bodies that do not support ephemeral pond-breeding species including anthropogenic lagoons and large lakes with predatory fish species.
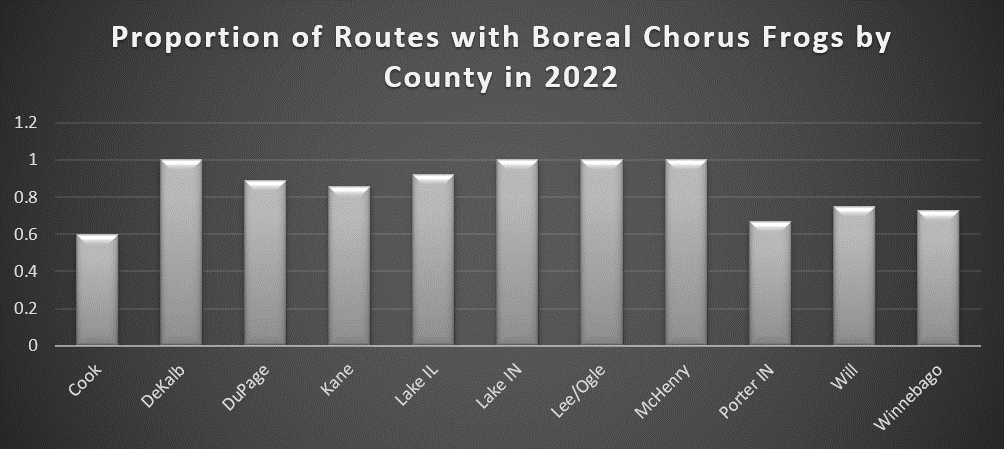
Figure 4. Proportion of routes in the network with boreal chorus frog detections in 2022.
Spring peepers were not detected during surveys in DeKalb County or in Will County in 2022. For the remaining counties, detection of spring peepers across routes varied from 12-100% of routes (Fig 5.).
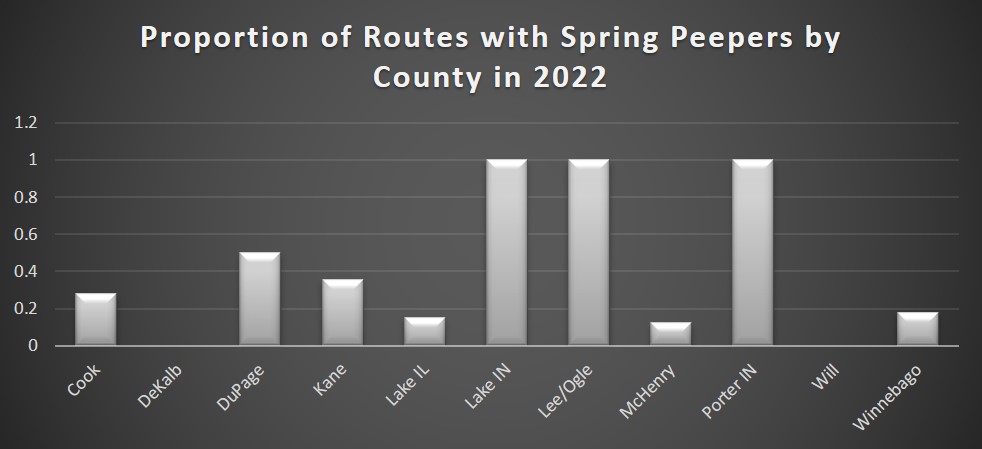
Figure 5. Proportion of routes with spring peeper detections across counties in 2022 surveys.
While northern leopard frogs are fairly widespread throughout the Chicago Wilderness region, they remain a difficult species to detect for novice monitors due to the low frequency calls which are often masked by louder, high frequency calls of Pseudacris species that overlap in phenology. Similarly, in areas with greater traffic volume, surrounding road noise may also mask the calls. No northern leopard frog calls were detected in the northwestern Indiana sites, but for counties in Illinois, the species was detected across 16-55% of routes. DuPage, McHenry, and Lee/Ogle County routes had the greatest proportion of routes with northern leopard frog detections (Fig. 6).
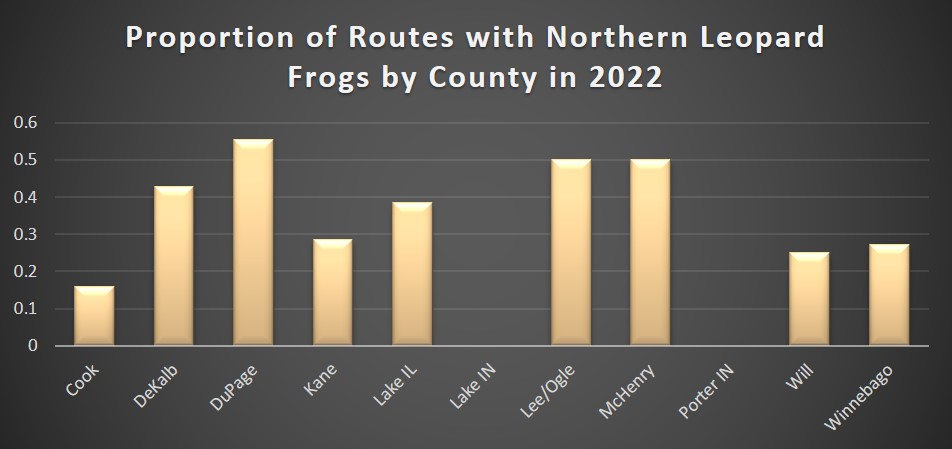
Figure 6. Proportion of routes with northern leopard frog detections by county in 2022 surveys.
American toads are a widespread species in the region. However, during the 2021 drought, which coincided with typical peak breeding activity for the species, many breeding sites had dried. In 2022, monitors detected American toad calling activity across 25-100% of routes in participating counties except for Lake County, IN (represented by a single route) (Fig. 7).
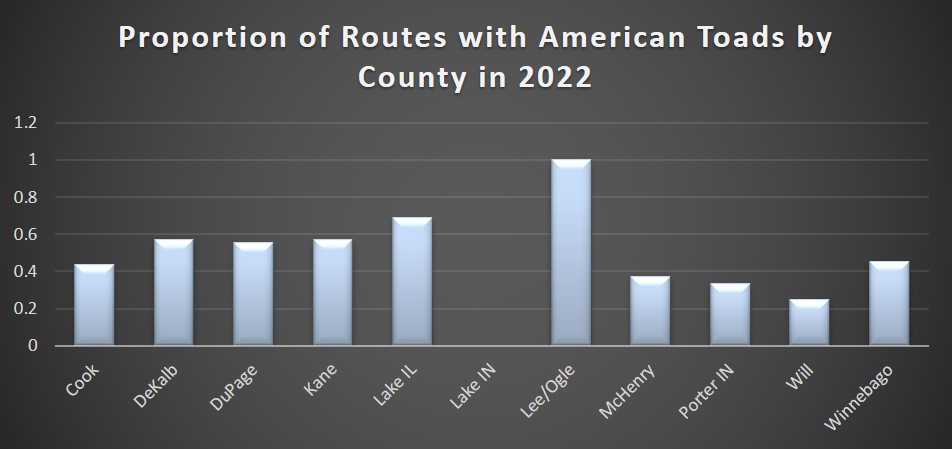
Figure 7. Proportion of routes with American toad detections across counties during 2022 surveys.
Eastern gray treefrogs and Cope’s gray treefrogs were detected in most counties except for Will County in 2022 (Figs. 8 and 9). We observed differences in distributions of the two treefrogs within some counties based on watershed (e.g. DuPage, Lake, McHenry, Porter, Winnebago, and Cook County), while other counties had solely Cope’s gray treefrogs detected (e.g. DeKalb, Kane, and Lee/Ogle counties) (Fig. 10).
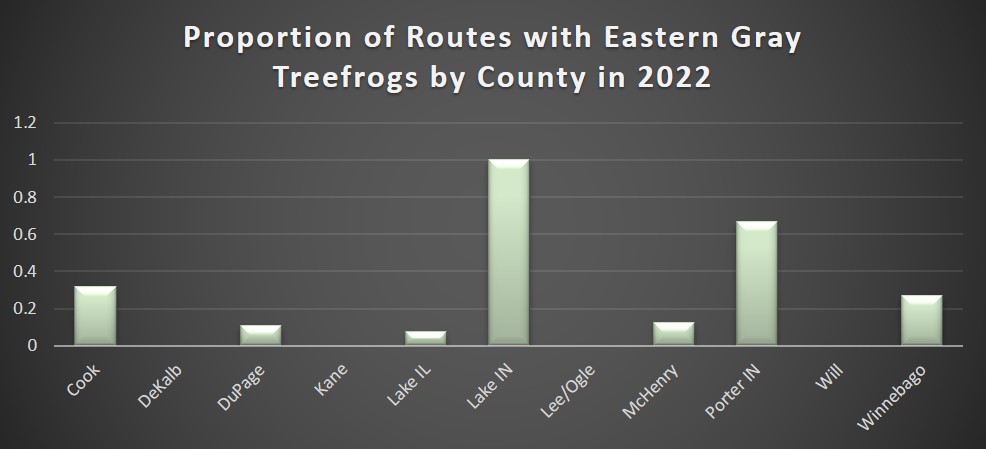
Figure 8. Proportion of routes with eastern gray treefrogs detected across counties during 2022 surveys.
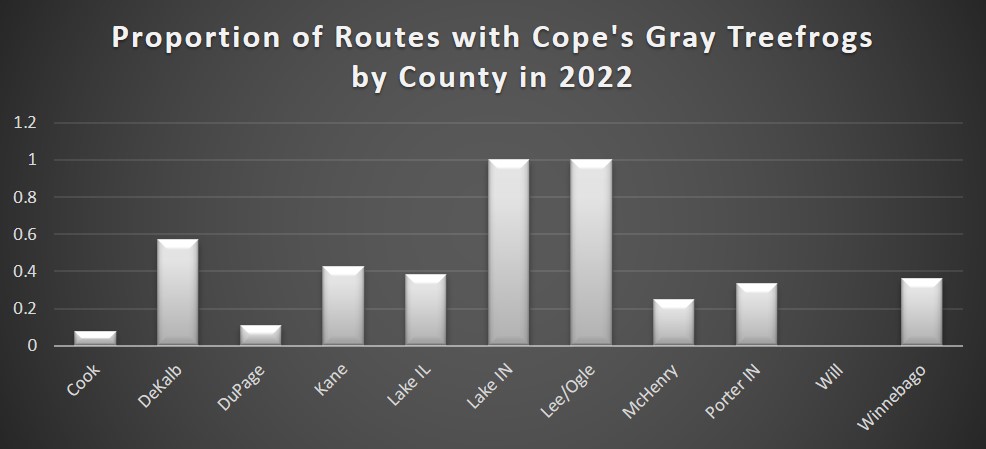
Figure 9. Proportion of routes with Cope’s gray treefrogs detected across counties during 2022 surveys.
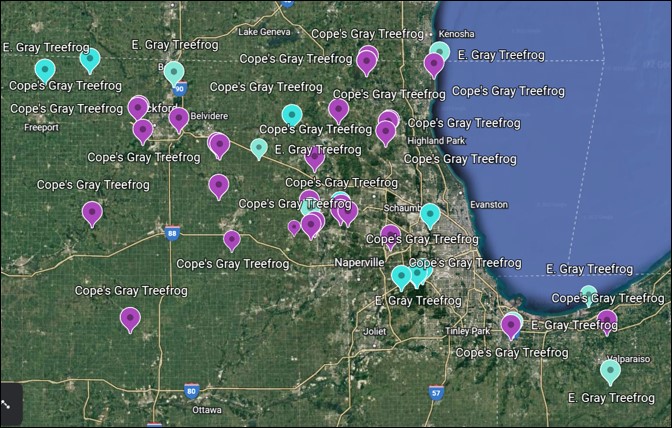
Figure 10. Distribution of Cope’s gray treefrog (purple markers) and eastern gray treefrog (blue markers) in the Calling Frog Survey monitoring area in 2022.
Blanchard’s cricket frogs were absent from routes in Cook, Kane, Lake (IL), Lee/Ogle, McHenry and Winnebago counties (Fig. 11). As in most recent survey years, detections of cricket frogs remain restricted to the southern portion of the Calling Frog Survey region with confirmed detections in southern DuPage County, Will County, northwestern Indiana sites in both Lake and Porter counties, and in multiple sites in DeKalb County. We are aware of unmonitored sites in southern Kane and Kendall counties where the species is known to occur, and we hope to recruit monitors for those locations in future seasons.
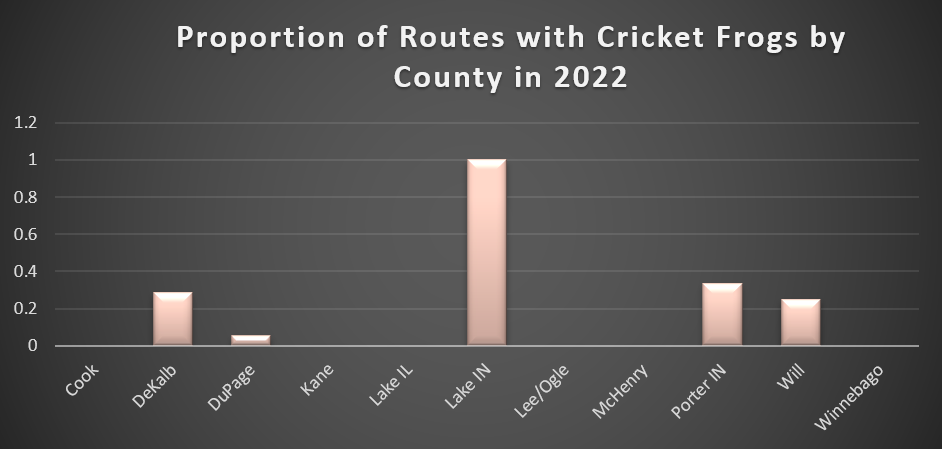
Figure 11. Proportion of routes with Blanchard’s cricket frog detections across counties during 2022 surveys.
Green frogs are another widespread species in the region with detections in all counties except for Lake County, IN (represented by one site) (Fig. 12). The proportion of routes across counties with green frog detections ranged from 44-100% in 2022 surveys.
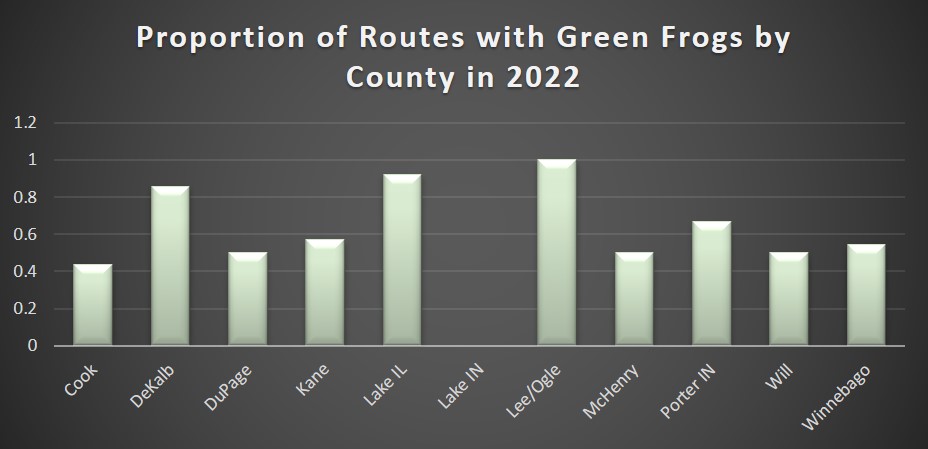
Figure 12. Proportion of routes with green frog detections across counties during 2022 surveys.
Along with green frogs, American bullfrogs are the other species that has shown a significant increase in the number of occupied sites from our long-term data set (1999-2021). Bullfrogs can make use of anthropogenic environments such as urban park lagoons, golf courses, and stormwater retention basins, as well as natural areas in the region. They were detected calling across 42-100% of survey routes in 2022 (Fig. 13).
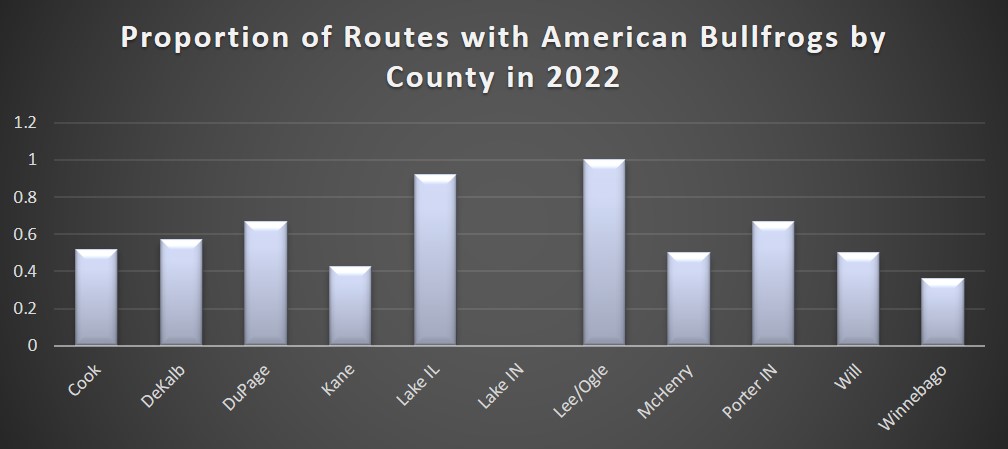
Figure 13. Proportion of routes with American bullfrog detections across counties during 2022 surveys.
Species Detections within Counties (arranged alphabetically)
In Cook County sites (represented by both Forest Preserve District of Cook County and Chicago Park District sites), boreal chorus frogs were the most widespread species occurring across 60% of routes, followed by bullfrogs, green frogs, and American toads. Other species detected included eastern gray treefrogs, spring peepers, northern leopard frogs, and Cope’s grey treefrogs (Fig. 14). Cook County had the greatest number of overall survey routes in the region (n = 25).
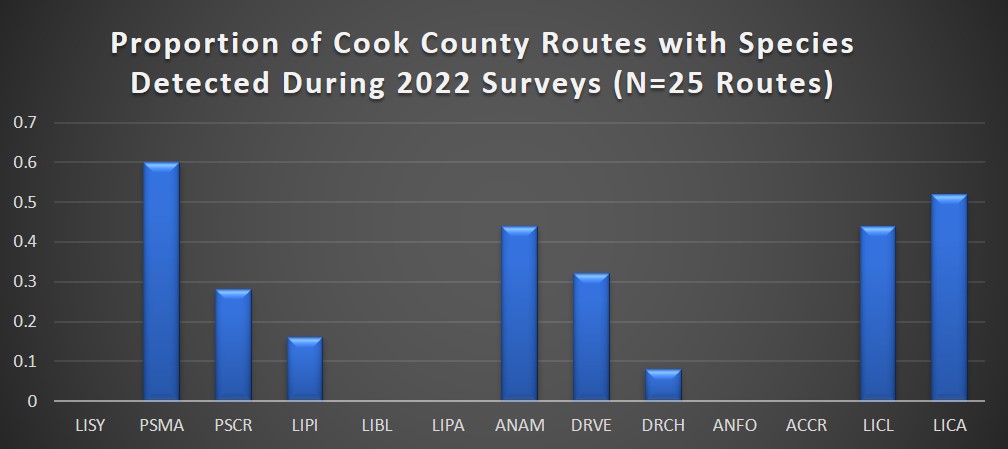
Figure 14. Proportion of sites with regional species detected within Cook County (FPD and CPD) during 2022 surveys.
For DeKalb County, we received data from seven survey sites. Boreal chorus frogs were detected across all survey routes (Fig. 15). The next most commonly detected species were green frogs. American bullfrogs, American toads, and Cope’s gray treefrogs were all detected across 57% of survey routes. Northern leopard frogs were detected on just over 40% of routes and Blanchard’s cricket frogs were found on 28% of routes.
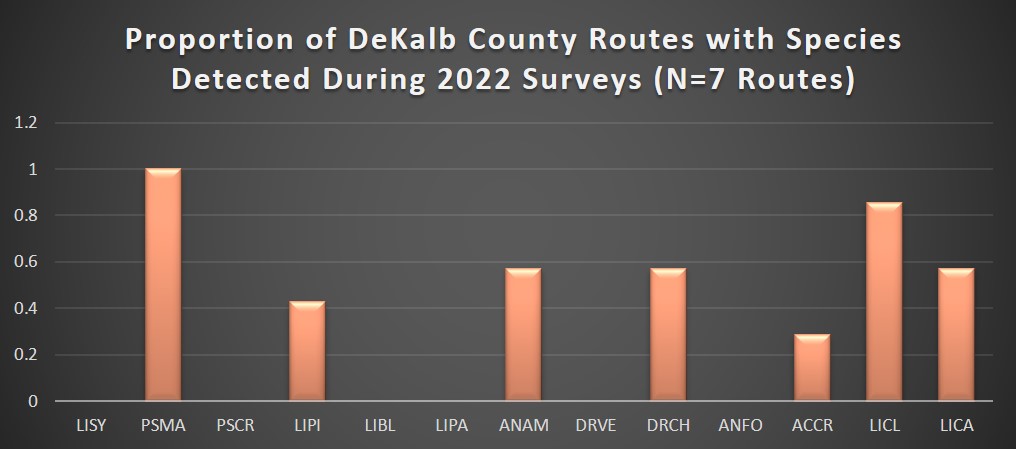
Figure 15. Proportion of sites with regional species detected within DeKalb County during 2022 surveys.
In DuPage County, we received data from a total of 18 survey routes including Forest Preserve District and Morton Arboretum routes. Boreal chorus frogs were detected on 88% of survey routes, followed by American bullfrogs on 66% of routes. Northern leopard frogs and American toads were detected on 55% of routes, followed by spring peepers on 50% of survey routes. Both species of treefrogs were reported on 11% of routes respectively, and Blanchard’s cricket frogs have continued to persist on 5% of the routes from the southern portion of the county (Fig. 16).
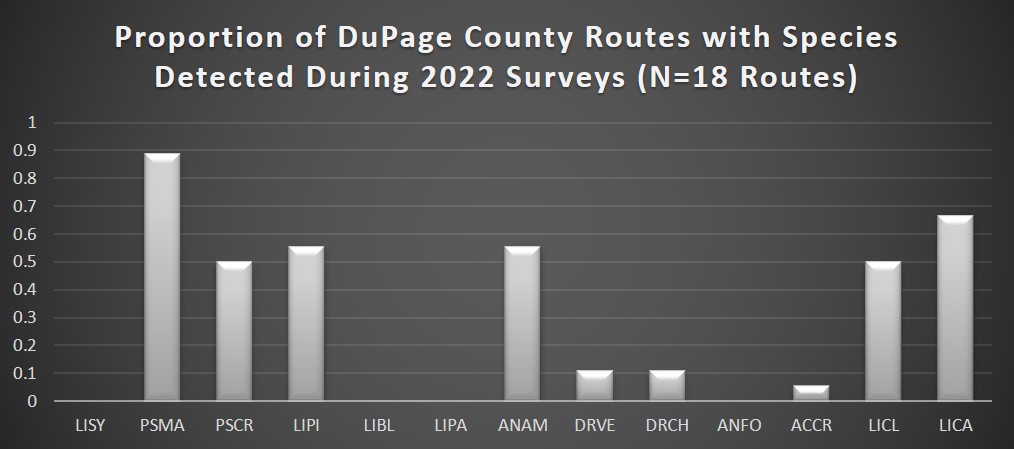
Figure 16. Proportion of sites with regional species detected within DuPage County (FPDDC and Morton Arboretum routes) during 2022 surveys.
We received data from a total of 14 survey routes in Kane County during 2022, from a combination of Forest Preserve District and St. Charles Park District sites. Boreal chorus frogs were the most common species with detection across 85% of routes, followed by green frogs and American toads at 57% of routes each (Fig. 17). Bullfrogs and Cope’s gray treefrogs were similarly abundant across 42% of survey sites. No eastern gray treefrog calls were detected or reported within the county. Spring peepers were detected on 35% of the routes, and northern leopard frogs were detected on 28% of the routes.
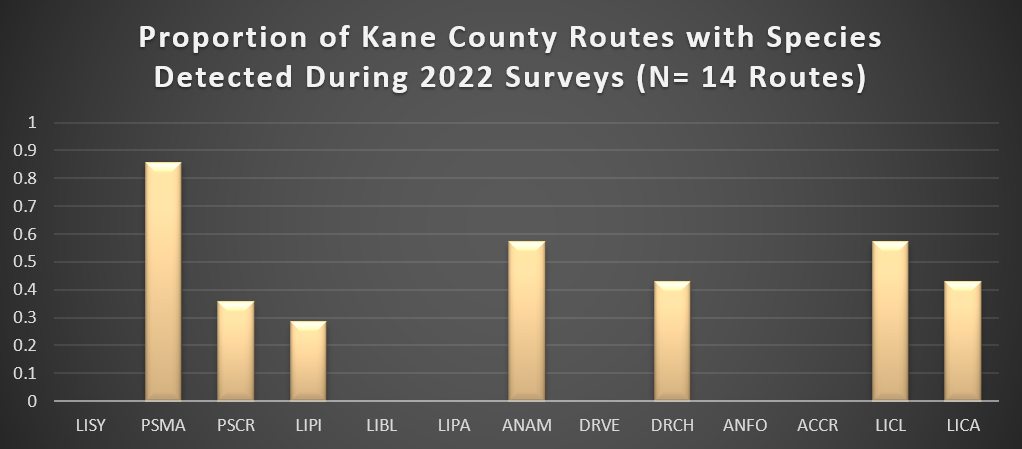
Figure 17. Proportion of sites with regional species detected within Kane County (FPD and St. Charles Park District) in 2022 surveys.
We received monitoring data from a total of 13 survey routes in Lake County, IL in 2022, primarily from Forest Preserve District sites, State Park, and Open Lands sites. Boreal chorus frogs and green frogs were the two most common species, with detections across 92% of survey routes, followed by bullfrogs across 84% of routes and American toads on almost 70% of routes (Fig. 18). Both species of gray treefrog were detected during monitoring, with Cope’s gray treefrog on 46% of routes and eastern gray treefrogs on 15% of routes. While spring peepers were detected on fewer routes than in previous seasons in Lake County, there were several assigned routes that are known to support the species, for which we did not receive data in 2022.
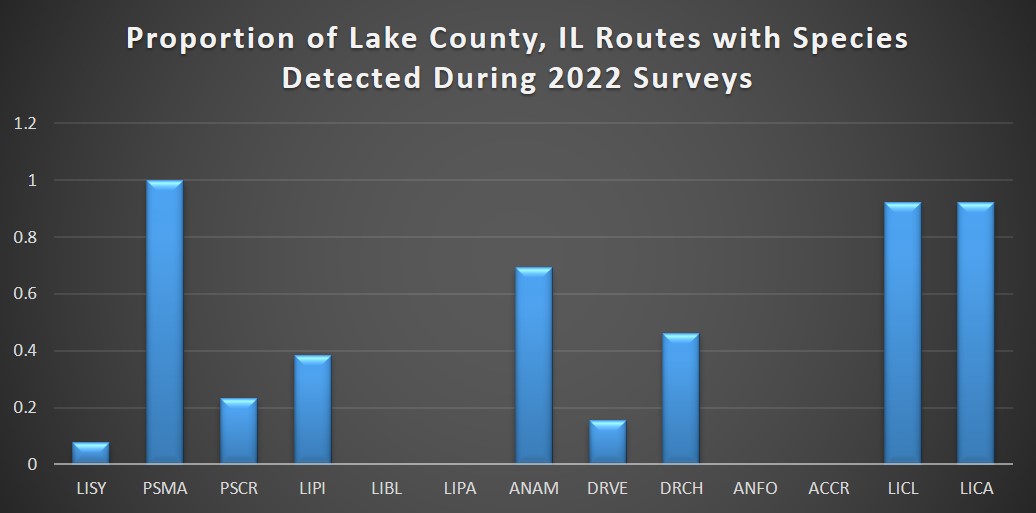
Figure 18. Proportion of sites with regional species detected within Lake County, Illinois (FPD, State Park, and OpenLands sites) in 2022 surveys.
For the two Lee/Ogle County routes located at Nachusa Grasslands, boreal chorus frogs, spring peepers, American toads, Cope’s gray treefrogs, green frogs, and bullfrogs, were detected on both routes. However, northern leopard frogs were reported on one of the two survey routes (Fig. 19).
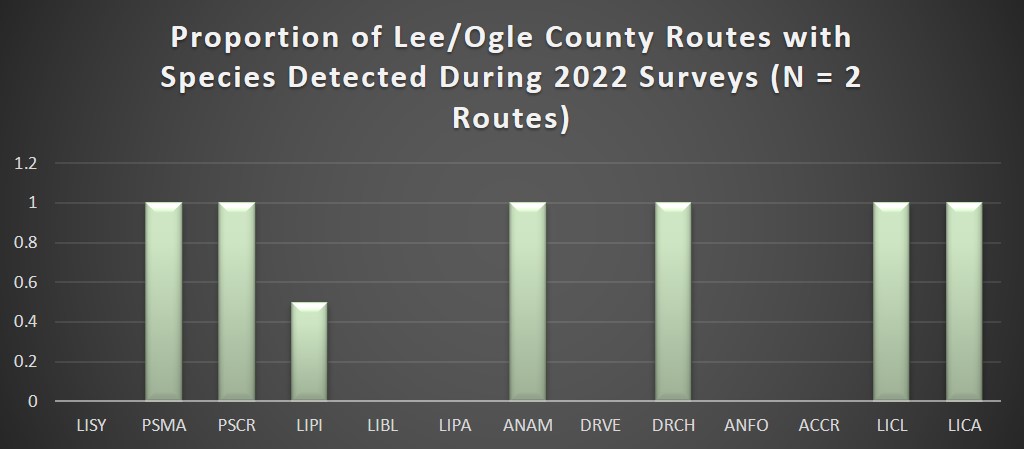
Figure 19. Proportion of routes with regional species detected on Nachusa Grasslands surveys in 2022.
In McHenry County, we received data from seven survey routes in 2022. Boreal chorus frogs were the most common species, with detections across all survey routes (Fig. 20). Bullfrogs and green frogs were the next most common species with detections across 57% of the routes. American toads and northern leopard frogs were detected across 42% of survey routes, Cope’s gray treefrogs on 28% of routes, and spring peepers and eastern gray treefrogs on 14% of survey routes.
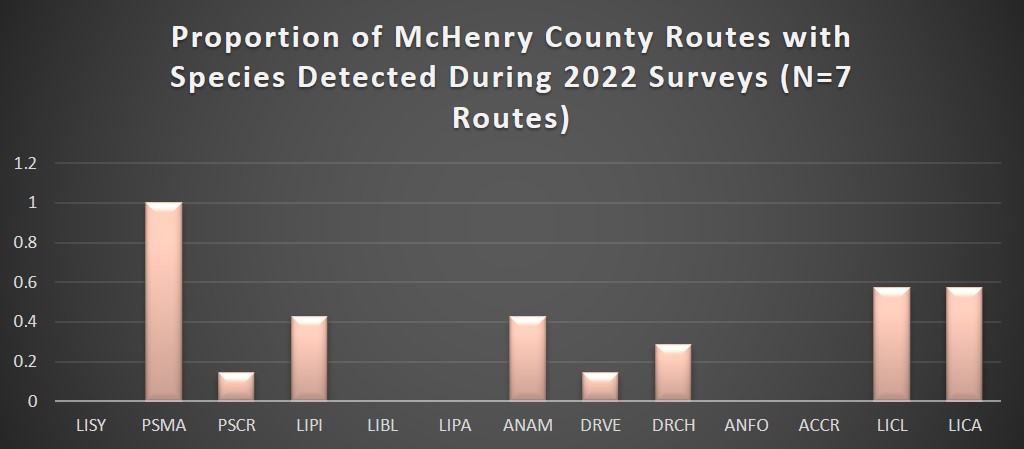
Figure 20. Proportion of sites with regional species detected within McHenry County (Conservation District and Moraine Hills State Park) in 2022 surveys.
We received data from three routes in Porter County, Indiana from National Park Service and State Nature Preserve sites. Spring peepers were the most common species, occurring on all of the routes, followed by boreal chorus frogs, eastern gray treefrogs, green frogs, and bullfrogs on 66% of the routes. Wood frogs, American toads, Cope’s gray treefrogs, and cricket frogs were detected on 33% of routes (Fig. 21). No northern leopard frog detections were reported, but the calls may have been masked by louder species like the spring peeper. Additionally, we did not receive 2022 data from two other Porter County sites where northern leopard frogs are regularly detected.
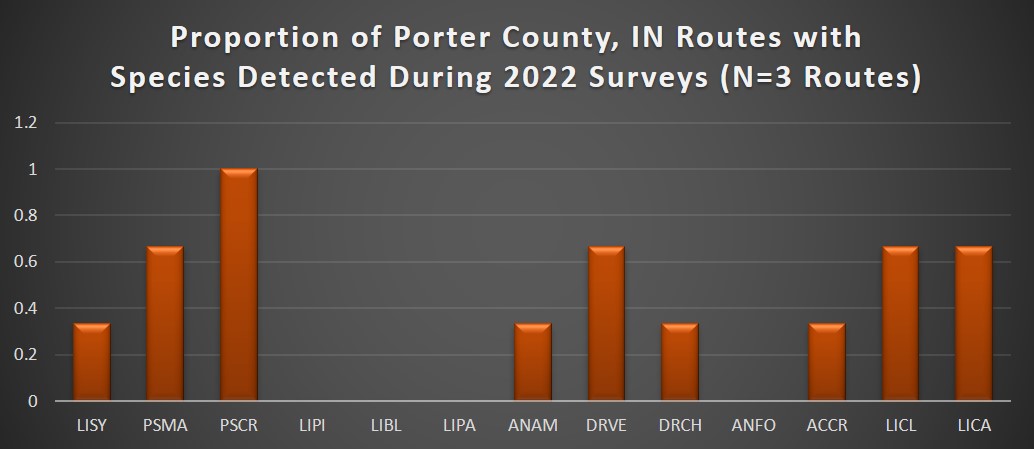
Figure 21. Proportion of sites with regional species detected within Porter County, IN in 2022 surveys.
For Will County, we received data from four survey routes in 2022. Boreal chorus frogs were detected on 75% of survey routes, followed by bullfrogs and green frogs on 50% of routes. American toads, northern leopard frogs, and chorus frogs were each detected on 25% of routes. We did not have any Will County survey routes report spring peepers or gray treefrogs during 2022 surveys (Fig. 22).
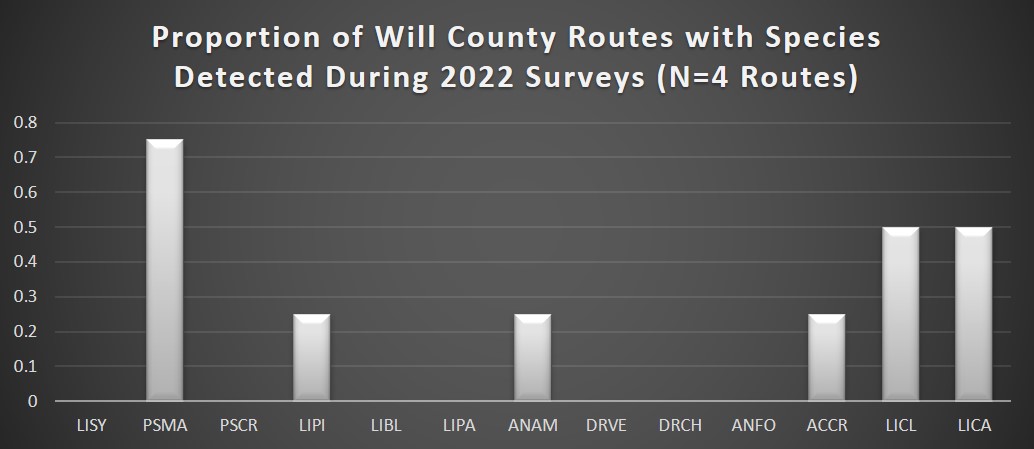
Figure 22. Proportion of sites with regional species detected within Will County in 2022 surveys.
For Winnebago County, we received data from 11 survey routes for the 2022 season. Boreal chorus frogs were detected across 72% of routes, followed by green frogs on 63% of routes. American toads were detected on 45% of routes. Bullfrogs and Cope’s gray treefrogs were detected on 36% of survey routes, while eastern gray treefrogs and northern leopard frogs were found on 27% of routes. Spring peepers were detected on 18% of survey routes (Fig. 23).
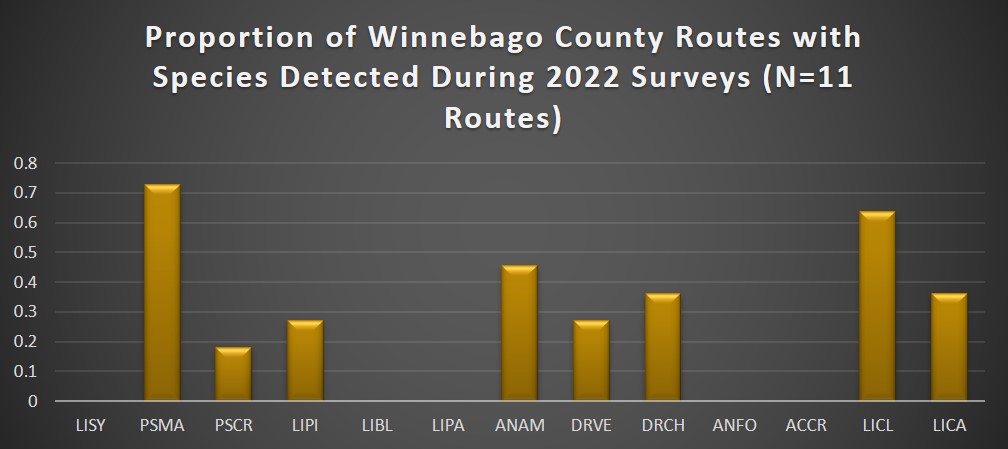
Figure 23. Proportion of sites with regional species detected within Winnebago County Forest Preserves in 2022 surveys.